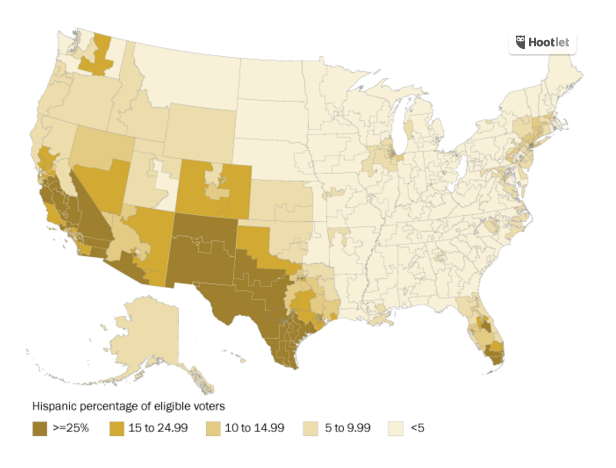
Mapping the Latino Electorate by Congressional District
*What’s startling to me about this map, after I went to my congressional district and found that it’s 60% Latino, was the number of districts represented by anti-Latino, anti-immigrant congressperson where Latinos are the majority eligible voting age population. VL
A record 27.3 million Latinos will be eligible to vote in the 2016 presidential elections. See how the share of Latino voters varies by congressional district in our interactive maps below.
Click on the map to go to the interactive Pew site.