2012 PRIMARY ELECTION PROFILE: TEXAS
ELECTION DAY: Tuesday, May 29, 2012
ELECTORAL COLLEGE VOTES: 38
TOTAL POPULATION (2010): 25,145,561
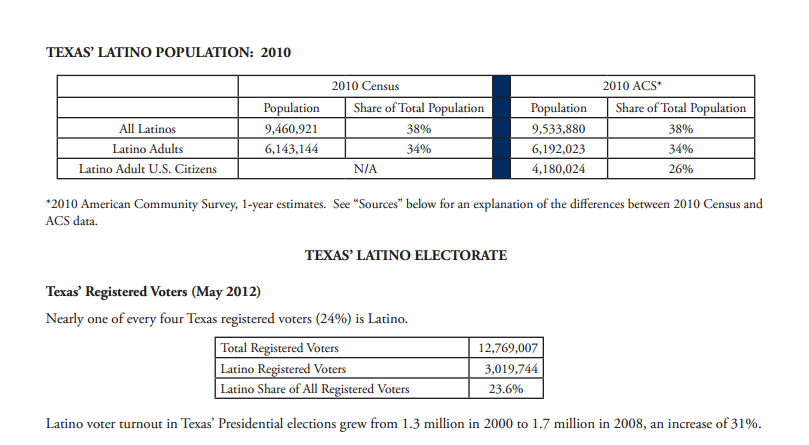
LATINO POPULATION (2010): 9,460,921
PROJECTED LATINO VOTE IN 2012: 1,987,000
PROJECTED LATINO SHARE OF TEXAS VOTE: 21.3%
In the last three presidential contests, Texans have generally supported the Republican candidate – in 2000 and 2004, the state handed decisive victories to its former governor, George W. Bush, who received 59% and 61% of the vote, respectively. In 2008, U.S. Senator John McCain’s (R-AZ) margin of victory was somewhat smaller, when he garnered 55% of the vote. In contrast, exit poll data suggest that Latino partisan preferences in the presidential contests fluctuated significantly between 2004 and 2008. In 2004, these data indicate that the Latino vote was nearly evenly split between Senator John Kerry (D-MA) and President Bush (50% to 49%). In 2008, the gap between the Republican and Democratic candidates appeared much larger, with 63% of Latinos supporting President Obama compared to 35% for Senator McCain.
Latinos played a particularly key role in Texas’ 2008 Democratic presidential primary contest. In 2008, both parties changed their primary schedules, and a large cluster of elections took place near the start of the year. Because many major primaries or nominating caucuses had occurred by February 5 (“Super Duper Tuesday”), some political observers predicted that the presidential nominees for both parties would be determined by that date. However, in a remarkable turn of events, the Democratic race proved so competitive, that the early primaries did not decide it.
With its March 4 election, Texas became a key battleground for the Democratic nominees. Exit poll data suggest that the Latino vote was crucial to the victory of Senator Hillary Clinton (D-NY) in Texas, which essentially allowed her to remain a viable candidate in the Democratic primary. Senator Clinton’s margin of victory among all Texas Democrats was relatively narrow. She received 50.9% of the vote compared with then-Senator Obama’s 47.4%. The exit poll data indicate that Texas Latino Democrats favored Senator Clinton over Senator Obama by 66% to 32%. Former President Bill Clinton had called Texas a “must -win,” and the victory for the former First Lady was her first after 11 straight losses to Sen. Obama. After the Texas win, Sen. Clinton said afterward that “this campaign has turned a corner,” and that support from Latino voters was essential to her comeback.
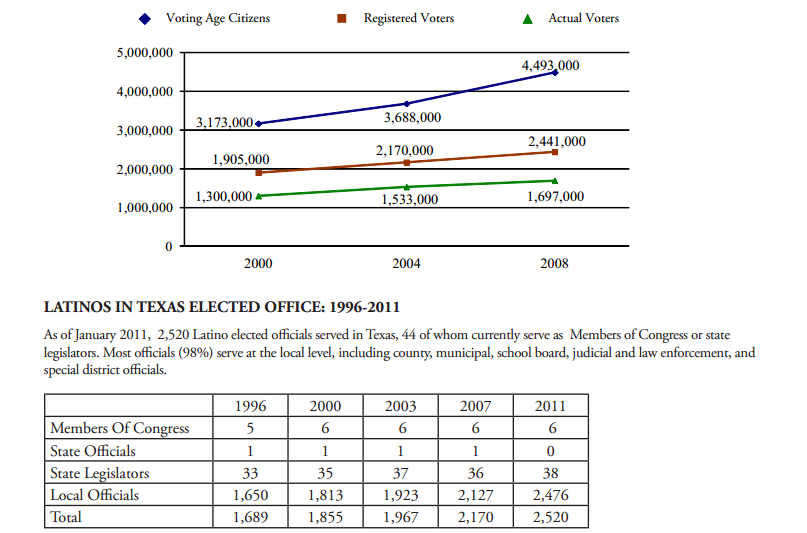
With Latinos now comprising nearly one of every four Texas registered voters (24%), Latino voters are poised to play a key role in this years’ primary and general elections. As noted below, redistricting is providing the Latino community with greater opportunities to obtain fair representation in some parts of the state, and political observers will be watching the results of Congressional and state elections to gauge the impact of the Latino electorate.
Texas’ Latino Population and Redistricting Between 2000 and 2010, Texas’ population grew from 20.9 million to 25.1 million, an increase of 20.6%. During the same period, the Latino population grew from 6.7 million to 9.5 million, an increase of 41.8%.
TEXAS POPULATION GROWTH: 2000-2010
After the 2010 reapportionment, Texas gained four additional Congressional seats, the most of any state. Latinos accounted for nearly two-thirds (65%) of Texas’ growth since 2000, and the Latino population increase was largely responsible for the state’s Congressional gains.
The new Congressional and state legislative maps initially adopted by the Texas state legislature in 2011 became the subject of protracted litigation, partly because the maps failed to comply with provisions of the federal Voting Rights Act of 1965 (VRA) which provides protection against redistrictings that discriminate against the Latino community. Under Section 5 of the VRA, Texas’ maps must receive federal approval before they can go into effect. The U.S. Department of Justice (DOJ) opposed the maps, because the DOJ believed they were enacted with an intentionally discriminatory purpose and failed to reflect the significant Latino growth in the state. In February 2012, a federal court in San Antonio released interim maps that will be used for the 2012 elections. These maps must still receive approval from either the DOJ or the U.S. District Court for the District of Columba before they become the final maps for the decade, and there may be further changes to the interim maps.
The interim Congressional map creates two new districts where Latinos will have a strong opportunity to elect the candidates of their choice (“opportunity districts”). One is Congressional district 33 in the Dallas-Fort Worth area, and the other is Congressional district 35, which runs from Austin to San Antonio. Some advocates have expressed concerns about the interim House of Representatives map, because they feel it does not create enough new opportunity districts in the state. These advocates believe that the map provides for 34 Latino opportunity districts, but fails to create an additional opportunity district in the Nueces County area.
Sources
NALEO Educational Fund, 2011 National Directory of Latino Elected Officials.
This report uses data from the U.S. Census Bureau’s 2010 American Community Survey (ACS), 1-year estimates, and the 2010 Census Summary File 1. The ACS is conducted every year and is an on-going survey of a sample of the population which produces estimates of various population characteristics. The 2010 Census provides data from the official count of the entire population that is conducted every 10 years. Differences in the two data sources’ universes, reference periods, and the way in which the data are tabulated may affect the comparability of data from the sources.
U.S. Census Bureau, Current Population Survey (CPS), Voting and Registration in the Elections of November: 2000-2008. The CPS data used in this report and the survey from which they are derived are subject to certain limitations. First, actual voter turnout and registration may be overestimated by the CPS, because individuals may tend to over-report electoral participation.
Additionally, the CPS is a national survey, and estimates derived for smaller sub-groups within the national population may be based on relatively small sample sizes. Consequently, the margin of error associated with estimates of voting and registration for these sub-groups is greater than the margin associated with the national population or larger population sub-groups.
The Latino vote projections were derived by taking the Latino vote in 2008, and increasing it by the average of the perecentage change in the Latino vote for the last three presidential elections. The Latino vote in the last three presidential elections is from Voting and Registration in the Elections of November: 2000-2008. Because these projections are based solely on past voting trends, they are conservative estimates that do not take into account the potential increase in Latino turnout that could result from the growth in Latino naturalizations, more robust voter engagement efforts, or other factors.
2012 NGP Voter Activation Network voter file data, May 2012.
A REPORT OF THE NALEO EDUCATIONAL FUND: The nation’s leading non-profit organization that facilitates full Latino participation in the American political process, from citizenship to public service.


