Mapping the Latino Population, By State, County and City

Today, the 100 largest counties by Hispanic population contain 71% of all Hispanics. Los Angeles County alone contains 4.8 million Hispanics, or 9% of the nation’s Hispanic population. But the share of all Hispanics who live in these counties has fallen from 75% in 2000 and 78% in 1990, reflecting Hispanic population growth outside of these 100 counties.
About half of these counties are in three states – California, Texas and Florida. Along with New York, Illinois, Arizona, New Jersey and Colorado, these eight states contain three-quarters of the nation’s Latino population. But with the dispersal of the U.S. Latino population across the country, this share too is down from 79% in 2000 and 83% in 1990.
The Hispanic population’s diversity is reflected in its geography. Across the largest U.S. metropolitan areas by Hispanic population, the mix of Hispanic origin groups varies. In the Los Angeles-Long Beach metropolitan area, and in most metro areas in the border states, Mexican-origin Hispanics are the dominant group. The composition differs along the east coast. In the New York-Northeastern New Jersey metropolitan area, Puerto Ricans and Dominicans are the dominant Hispanic-origin groups, Cubans are the dominant Hispanic group in Miami-Hialeah and Salvadorans are the dominant group in the Washington, DC metro area. Nationally, Mexicans are the largest Hispanic-origin group, making up 64.6% of all Hispanics.
These findings are part of the Pew Research Center’s Hispanic population updates for every state and county, plus the 60 largest Hispanic metropolitan areas, as well as updated demographic and economic profiles of the Hispanic population for the states and those 60 metro areas. The data used in these updates is from the 2011 American Community Survey, the 2000 Census and U.S. Census Bureau county population datasets.
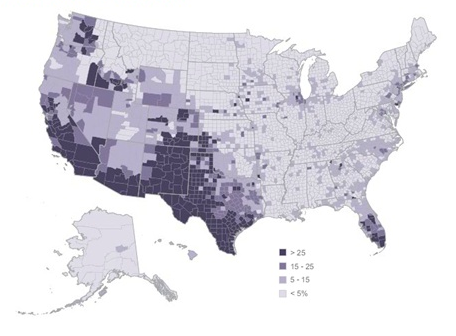
Accompanying these updates are an interactive map showing key Hispanic population characteristics in all 50 states and the District of Columbia; an interactive map, interactive table and interactive graphics showing Hispanic population characteristics in the 60 largest metro areas by Hispanic population; and interactive maps showing the size, share and growth in the Hispanic population in each of the nation’s counties between 1980 and 2011. All of these features can be found at the new Latinos by Geography page.

Among the key findings by state:
More than half (55%) of the U.S. Hispanic population resides in three states: California, Texas and Florida. California has the nation’s largest Hispanic population, with about 14.4 million Hispanics. California’s Hispanic population alone accounts for more than one-fourth (28%) of U.S. Hispanics.
New Mexico has the highest Hispanic population share (46.7% of the state’s population) among the 50 states and District of Columbia. Maine, West Virginia and Vermont were among those with the lowest shares.
Over the last decade, some of the fastest growing Latino populations are in the southeastern United States.
Among the key findings by county:
The 10 largest counties by Hispanic population account for almost one-third (30%) of the country’s Hispanic population. The 25 largest contain 46% of the nation’s Hispanic population.
Among all 3,143 counties in the U.S., 87 are majority Hispanic. Of those, 56 are in Texas.
Among counties with a Hispanic population of at least 1,000 in 2011, Georgia’s Stewart County experienced the most growth in the Hispanic population since 2000, growing 1,754% over 11 years.
Among the key findings by metropolitan area:
More than four-in-ten (44%) Hispanics live in the 10 largest metropolitan areas by Hispanic population.
The Los Angeles-Long Beach metropolitan area has the nation’s largest Latino population (5.8 million) and alone accounts for about one-in-ten (11%) Latinos nationally. The New York-Northeastern New Jersey metropolitan area is the second largest by Latino population (4.3 million) and is home to 8% of Latinos nationwide.
In Miami, 66% of the Hispanic population is foreign born, a share higher than any of the top 60 metro areas and the only metro area in the top 10 in which more than half of Hispanics are foreign born. By contrast, only 17% of Hispanics in the San Antonio area are foreign born. For U.S. Hispanics overall, the foreign-born share is 36%.
The report “Mapping the Latino Population, by State, County and City”, updated population profiles, as well as interactive maps and graphics, are available at here.
This article was first published in Hispanically Speaking News.
[Photo courtesy Pew Hispanic Report]